2025 Year in Review
- Through the OSA, companies continue to raise the bar on safety. The organization has and continues to accomplish this through bridging industry knowledge, advancing safety data and safety culture, all while aiming to reduce life changing injuries and fatalities. As the OSA leadership, we are proud to stand by our accomplishments, the resources we produce and share, and the growth of the organization.
- Sharing of Safety Related Learnings: Expanding on its most popular event, the OSA continues to offer basin-specific industry safety share forums. These highly popular events allow members to share incidents and associated learnings with attendees. The safety share forums also provide the OSA an opportunity to expand its network of partnerships with state and local organizations as well as an opportunity to expand the initiative’s membership.
- Collection, Aggregation & Analysis of Safety Data: 2024 was the fourth year that the OSA collected, aggregated and presented safety data from its membership. The OSA continues to engage with our partner and non-partner trade associations to adjust, align, and improve our reporting protocols.
- Growing the OSA’s Membership: The OSA continues to grow its lists of stakeholder groups. The primary goal of these groups will be to pool and leverage resources when hosting events, such as safety share forums, workshops, or discussion panels. With secondary goals being to share safety bulletins and hazard alerts to a broader community, connect the OSA’s resources to smaller organizations who may need guidance in better developing their own safety programs, as well as growing the OSA’s membership.
OSA Leadership
- GARRETT JACKSON, Devon Energy—OSA Chair
- CRAIG MCMILLIN, BPX Energy—OSA Rising Chair
- JEFF ATTEBERRY, Sr Policy Advisor Upstream—OSA Manager
OSA Participant Testimonial
Testimonial by JP Srock Vice President of Safety & Risk Management Atlas Energy Solutions: “Our decision to join the Onshore Safety Alliance was driven by a shared belief that collaboration is the most powerful tool we have to advance safety. It has given us access to a network of peers who face many of the same challenges we do, and the open exchange of ideas has allowed us to see new ways of improving our safety programs.
Being part of the OSA hasn’t just helped us refine our processes—it has helped us build stronger relationships across the industry. Those connections have brought in fresh perspectives, innovative solutions, and a renewed focus on making sure every individual returns home safely at the end of the day.
For us, the OSA is more than an alliance—it’s a community that holds each other accountable to raising the bar for safety, and that commitment has made a lasting impact on both our people and our operations.”
FPI/SIF
- FPI - The International Association of Oil & Gas Producers (IOGP) defines an FPI (Fatality Permanent Injury) as an incident that results in a fatality or permanent impairment. A fatality is defined as a death as a result of a work-related incident.
- permanent loss of body parts,
- permanent reduction of organ’s physiological function,
- permanent reduction in skin and musculoskeletal function, or a
- permanent reduction in psychological, social, or cognitive function
- SIF - The OSA defines a SIF (Serious Injury and Fatality) as an incident or near miss that results in or has the potential to produce a fatal or lifechanging injury or illness.
- Transition From SIF to FPI - SIF and FPI data are not directly comparable since they derive from two different definitions. We generally consider the FPI data to provide a more accurate indicator of OSA performance given that its definition is more definitive and comprehensive than SIF. Reported actual FPI data represents the most severe safety incidents, which in turn offer the greatest opportunity for learnings to avoid repeated incidents from occurring. This year’s reporting and annual report exclude potential SIF and FPI events as the reporting template for potential and near miss FPI was still under development during the annual reporting window. Going forward, actual, potential, and near miss FPI will be collected and reported.
FPI/SIF Stats
| Year | 2021 (SIF) | 2022 (SIF) | 2023 (SIF) | 2024 (FPI) |
|---|---|---|---|---|
| All Companies | 0.008 | 0.022 | 0.023 | 0.005 |
| Operators | 0.008 | 0.022 | 0.021 | 0.005 |
| Service Companies | - | - | 0.032 | 0.003 |
The table shows actual FPI and SIF rates per 100 full-time workers. This can be seen as Table 1 in the annual report.
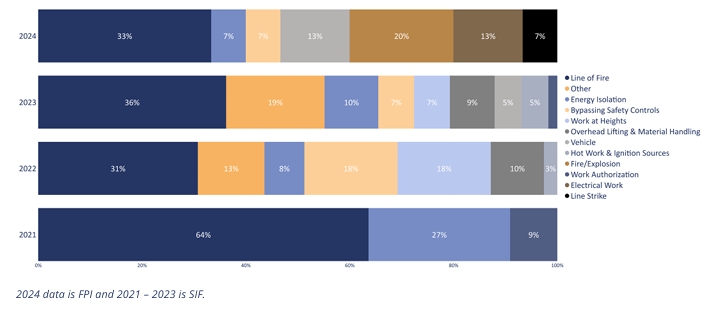
The figure shows actual FPI and SIF events by common hazard for all companies. This can be seen as Figure 5 in the annual report.
| Year | 2021 (SIF) | 2022 (SIF) | 2023 (SIF) | 2024 (FPI) |
|---|---|---|---|---|
| All Companies | 0.001 | 0.003 | 0.002 | 0.001 |
| Operators | 0.001 | 0.003 | 0.003 | 0.001 |
| Service Companies | - | - | 0.000 | 0.000 |
Data is from FPI and SIF Incident Reports. Data is based off count of injured persons as opposed to number of events. 2024 data is FPI and 2021 - 2023 is SIF.
The table shows actual fatality rates per 100 full-time workers. This can be seen as Table 7 in the annual report.
| Year | 2021 (SIF) | 2022 (SIF) | 2023 (SIF) | 2024 (FPI) |
|---|---|---|---|---|
| All Companies | 0.005 | 0.014 | 0.017 | 0.004 |
| Operators | 0.005 | 0.014 | 0.017 | 0.004 |
| Service Companies | - | - | 0.016 | 0.008 |
Data is from FPI and SIF Incident Reports. Data is based off count of injured persons as opposed to number of events. 2024 data is FPI and 2021 - 2023 is SIF.
The table shows actual life-altering injury and illness rates per 100 full-time workers. This can be seen as Table 9 in the annual report.
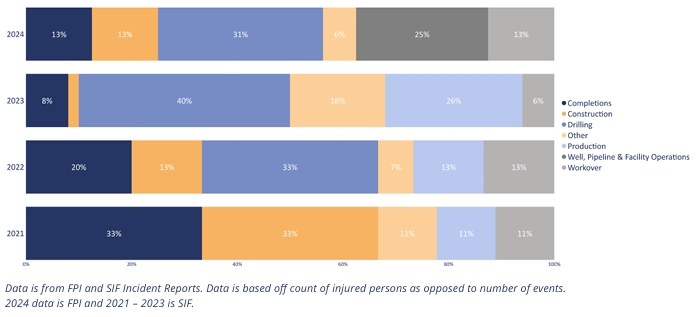
The figure shows actual FPI and SIF consequences by stage of operation for all companies. This can be seen as Figure 8 in the annual report.
| Year | 2021 (SIF) | 2022 (SIF) | 2023 (SIF) | 2024 (FPI) |
|---|---|---|---|---|
| All Companies | 0.002 | 0.003 | 0.002 | 0.005 |
| Operators | 0.002 | 0.003 | 0.003 | 0.004 |
| Service Companies | - | - | 0.000 | 0.024 |
The table shows Level 1 WCI rates per 100 full-time workers. This can be seen as table 16 in the annual report.
| Year | 2021 (SIF) | 2022 (SIF) | 2023 (SIF) | 2024 (FPI) |
|---|---|---|---|---|
| All Companies | 3 | 6 | 6 | 12 |
| Operators | 3 | 6 | 6 | 9 |
| Service Companies | - | - | 0 | 3 |
The table shows count of level 1 WCI. This can be seen as Table 17 in the annual report.
Key Aggregated Safety Data Highlights
Interest in learning more about the OSA's aggregated annual data? Click below to see additional safety by company type and incident type.