2024 Year in Review
- Through the OSA, companies continue to raise the bar on safety. The organization has and continues to accomplish this through bridging industry knowledge, advancing safety data and safety culture, all while aiming to reduce life changing injuries and fatalities. As the OSA leadership, we are proud to stand by our accomplishments, the resources we produce and share, and the growth of the organization.
- Sharing of Safety Related Learnings: The OSA continues to offer basin-specific industry safety share forums. These highly popular events allow members to share incidents and associated learnings with attendees. Attendees of these safety share forums are highly encouraged to ask questions, share experiences and knowledge, as well as pass-on the learnings gained to other colleagues in their organization. The safety share forums also provide the OSA an opportunity to expand its network with state and local organizations as well as an opportunity to expand the initiative’s membership.
- Collection, Aggregation & Analysis of Safety Data: This was the third year that the OSA collected, aggregated and presented safety data from its membership. Collecting and aggregating participants’ safety data is a major component of the OSA. Working to ensure alignment of this safety data and standardized analytical methodologies is equally important to ensure the highest data quality.
- Growing the OSA’s Membership: Since 2023, the OSA has grown from 39 member companies to 43 member companies. Thus far in the year, three new operators (89 Energy, Chesapeake Energy and Ovintiv) and one service company (Key Energy Services) have joined. Upticks of new companies expressing an interest to join the OSA are commonly seen after each safety share forum. This type of uptick in interest is a testament to the safety share forums’ success and popularity.
OSA Leadership
- SEAN FLYNN, Continental Resources—OSA Chair
- GARRETT JACKSON, Devon Energy—OSA Rising Chair
- JEFF ATTEBERRY, Sr Policy Advisor Upstream—OSA Manager
OSA Participant Testimonial
Testimonial by Garrett Jackson, Vice President EHS & Measurement at Devon Energy, “Safety is not about data or numbers—It is about people Devon Energy believes that doing the right thing, in the right way, is not only good for our people and the environment, but also for our business.”
Testimonial by Mike Garvin, President, Patterson-UTI Drilling Company, “Our participation with the Onshore Safety Alliance has been transformative, providing us with insights and collaborative opportunities that have elevated our safety standards and solidified our role as an industry leader in responsible operations. Being a part of the Onshore Safety Alliance has not only enriched our safety programs with innovative ideas but also strengthened our industry relationships, underscoring our commitment to ensuring every individual returns home safely”
SIF
- SIF - The OSA defines a SIF as an incident or near miss that results in or has the potential to produce a fatal or lifechanging injury or illness. Life-changing injuries or illnesses result in permanent or significant loss of a body part or organ function, or otherwise permanently change or disable that person’s normal life activity. SIF events may also be referred within the industry as near misses, significant near misses, serious exposure, potentially serious incidents or high potential events.
SIF Stats
| Year | 2021 | 2022 | 2023 |
|---|---|---|---|
| All Companies | 0.008 | 0.022 | 0.023 |
| Operators | 0.008 | 0.022 | 0.021 |
| Service Companies | - | - | 0.032 |
Table 1 from the Annual Report above shows actual SIF rates per 100 full-time workers.
| Year | 2021 | 2022 | 2023 |
|---|---|---|---|
| All Companies | 0.001 | 0.003 | 0.002 |
| Operators | 0.001 | 0.003 | 0.003 |
| Service Companies | - | - | 0.000 |
Table 6 above displays actual fatality rates per 100 full-time workers.
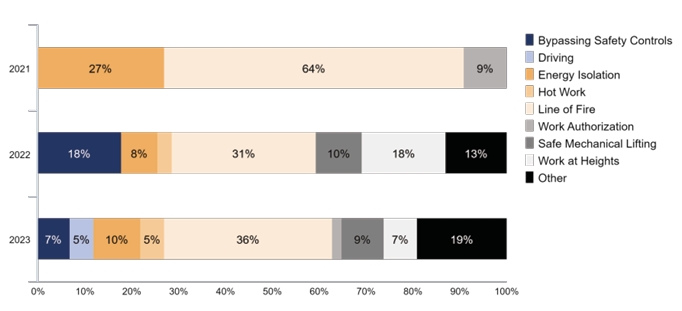
Figure 4 from the Annual Report displays actual SIF events by common hazard by both operators and service companies.
| Year | 2021 | 2022 | 2023 |
|---|---|---|---|
| All Companies | 0.005 | 0.014 | 0.017 |
| Operators | 0.005 | 0.014 | 0.017 |
| Service Companies | - | - | 0.016 |
Table 8 from the Annual Report highlights actual life-altering injury and illness rates per 100 full-time workers.
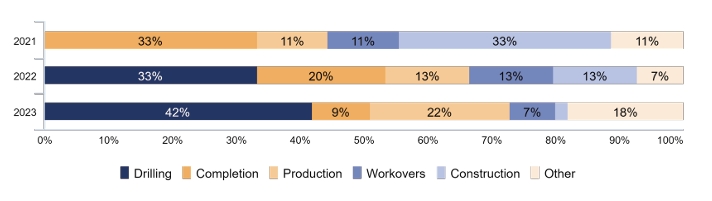
Figure 7 from the Annual report displays actual SIF events by stage of operation for operators and service companies.
Key Aggregated Safety Data Highlights
Interest in learning more about the OSA's aggregated annual data? Click below to see additional safety by company type and incident type.